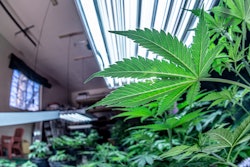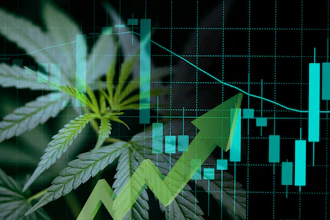
As the cannabis industry is developing rapidly, so is the necessity to effectively compare different operators in order to measure efficiency and find the right business opportunities. Regardless of the industry, companies and initiatives in business are compared by examining Key Performance Indicators (KPIs), or metrics that attempt to distill how well a company achieves key business objectives. The paramount requirements when selecting KPIs are their validity and whether they accurately measure what is intended.
Early cannabis industry KPIs like yield per light and grams per watt do not lend themselves well to making meaningful broad-based comparisons. Even the more recently adopted KPI grams per square foot is inherently flawed and invalid. A KPI for the cannabis industry should really take into account productivity (yield), spatial efficiency, the cost of production and time.
Let’s Review Why Past KPIs Fail
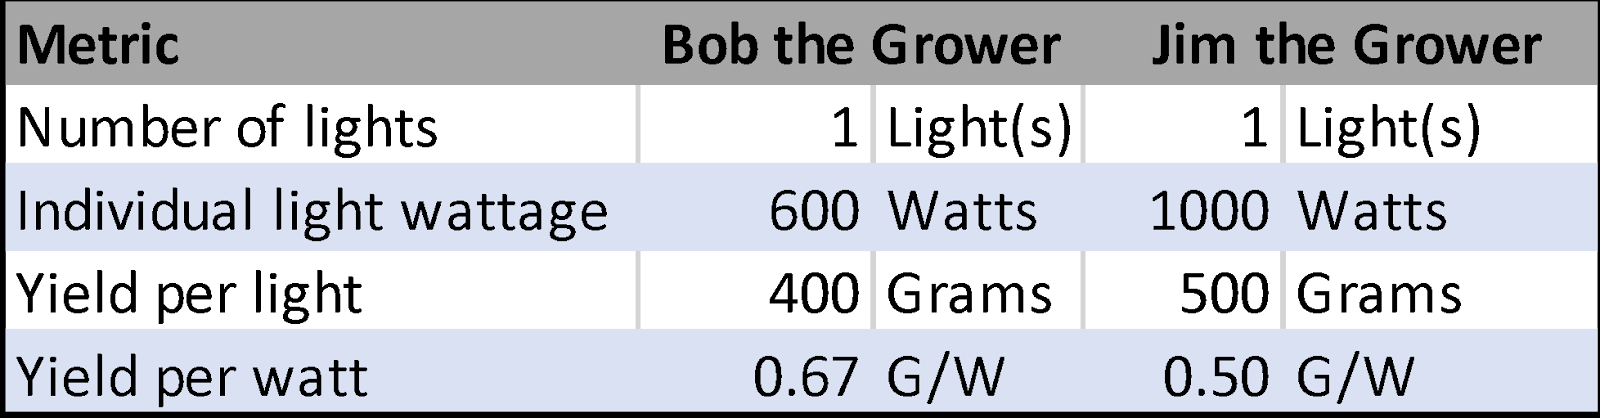
Yield per light (YpL) was one of the earliest comparative metrics that evolved in the industry. The YpL provided a metric for growers to prove they were “better” than another grower. Let’s look at the following example:
Bob is a new-school cultivator who tries to incorporate the most recent growing technology, best practices and research into his garden.
Jim is an old-school grower, focused on what has worked and delivered results in the past. He’s not interested in “new-fangled” technology or expensive “magic” products.
In identical grow rooms, Bob produced 400 grams of flower under one light, and Jim produced 500 grams under a different light. Jim produced 100 grams more flower than Bob, so when comparing the YpL, Jim won, but which grower was actually more productive?
Lights have different wattages; HID lights most commonly come in 400W, 600W and 1000W models, whereas commercial LEDs, which are more efficient, typically range from 550 to 650W. (Yield is more strongly correlated to light intensity than wattage, and LEDs offer more intensity per watt.) Say Bob and Jim were both using lights with different wattages – their expected yields would be different. If Bob produced 400 grams using a 600-watt light and Jim produced 500 grams with his 1000-watt light, then Bob actually produced one-third more per watt of electricity (0.5 grams per watt vs 0.67 grams per watt). A KPI should take into consideration the light wattage and efficacy more so than the number of lights used.
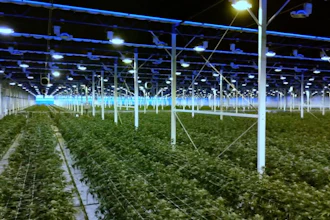
Another major issue with the yield-per-light KPI is that it fails to consider variance in the cultivation area. Assume Bob and Jim both use 1000-watt lights, and both growers produce 500 grams of trimmed flower from their respective harvests. In this scenario, it would appear Bob and Jim are equally productive. However, this conclusion changes when you consider Bob placed his light over 16 sq ft of canopy and Jim had his light over a 25 sq ft canopy. Measuring production per square foot of canopy, Bob produced 31.25 grams, while Jim only did 20 grams; in other words Bob produced 56.25% more per square foot than Jim. This disparity illustrates why a KPI should incorporate an evaluation of area.

Another variable that must be included into a valid KPI is the cost of production, which includes all of the expenses related to growing a given amount of cannabis. For indoor cultivators, the primary contributing factors to the cost of production are electricity, labor and materials (consumables). While light wattages have a significant impact on cultivation costs (electricity consumption), one needs to take into account the total costs of producing flower, not only the electrical component. Let’s check on Bob and Jim again to see why...
Again, assume Bob and Jim have identical gardens and produce the same amount of finished flower. Jim uses a name-brand fertilizer program that adds $78 to the cost of each pound, whereas Bob uses a salt-based fertilizer program that only adds $15 to the cost per pound. This translates to Bob’s cost per gram of flower being $0.139 less than Jim’s. While 14 cents may seem insignificant, when you expand the example to a commercial scale, the impact is profound. All costs of production must be considered in a comprehensive KPI (not just electricity consumption).

One of the biggest costs that needs to be included in our KPI criteria, and yet has been historically overlooked, is the cost of time. As the saying goes “Time is money.” It’s impossible to measure efficiency and do good business while ignoring the dimension of time. Let’s run more with our Jim and Bob examples.
If Jim uses an organic super soil and Vegs his plants for four weeks, then flowers for nine while Bob uses an automated hydroponic drip system and Vegs his plants for two weeks before flowering them for nine, then the two-week time difference over the course of a year adds up.

Isolating the other variables, Bob’s additional 0.73 harvests every year makes him 18.2% more productive per year than Jim. Clearly, time must be part of the KPI equation.
A New, Comprehensive KPI To Measure It All
A valid KPI for the industry should incorporate area, costs of production and time. I propose that a useful and effective KPI for the industry to adopt would be: grams (yield) per sq ft of canopy (area) per day (time) at the specific cost per gram.
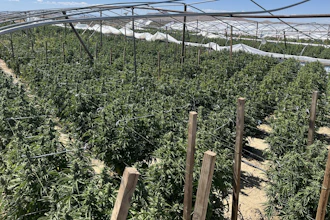
Running with our Bob and Jim example, let’s say both growers received funding and are moving into a commercial facility with 100 lights, as opposed to one each, and that each grower’s garden size is now 100 times larger than what it previously had been. Thus far, we’ve been isolating variables to demonstrate the specific effect each metric discussed has on the outcome. Now, to give a more realistic and comprehensive view of commercial operations, without isolating any variables.

In our example, we’re saying Bob uses 900 sq ft less than Jim (area), each of his lights use 370 watts less electricity, and his crop cycle is six days shorter, so he produces 18,950 grams less per harvest and he has 0.38 more crop cycles per year. Using the new KPI, we can see that Bob produces 0.90 grams per sq ft per day at a cost of $0.85 per gram. In comparison, Jim produces 0.63 grams per sq ft per day at a cost of $0.98 per gram. The chart above makes for a clear-cut comparison of the two growers’ gardens. We can clearly see that when compared to Jim, Bob produces more product at a lower cost, making Bob’s commercial grow ultimately more efficient.
Comparing Apples to Oranges…Yes, It Can Be Done
In cannabis, there definitely is a fundamental challenge to comparing dissimilar cultivation styles; yet as the industry has grown and there’s been a proliferation of companies in the sector, these differences have only become more pronounced. Past KPIs have been too simplistic and narrowly focused, making it impossible for people to draw valid, accurate comparisons from them. Thus, they are unreliable as a resource for guiding the most advantageous business decisions.
Now, while we’ve outlined a solid, foundational KPI, it’s important to keep in mind that there are a myriad of complexities and intricacies that one would also need to consider when measuring efficiencies. Just to give one specific example, we haven’t addressed moisture content in cannabis. The more moisture, the less biomass and cannabinoids will be present in the sample, and thus the less valuable the yield will be. The point is that there are so many factors at play and our KPI is not all-encompassing. Nevertheless, we start by examining how the principle factors of yield, area, time and cost intersect. By measuring grams produced per square foot of canopy per day at X price per gram, we’re able to level set and accurately compare disparate cultivation methodologies in order to make better, more informed business decisions. In a sense, we’ve found the ever elusive way to compare apples and oranges.